|
|
 |
|
Investment Objective/Strategy - The Fund seeks investment results that correspond generally to the price and yield (before the fees and expenses) of the Nasdaq US Rising Dividend Achievers™ Index (the "Index"). The Fund will normally invest at least 90% of its net assets (plus the amount of any borrowings for investment purposes) in securities that comprise the Index. The Index is comprised of a selection of companies with a history of raising their dividends and that exhibit the characteristics to potentially continue doing so in the future. The Index construction process considers a company's earnings growth, levels of cash compared to debt and the amount of earnings that are paid out as dividends.
There can be no assurance that the Fund's investment objectives will be achieved.
- The First Trust Rising Dividend Achievers ETF (RDVY) is based on the Nasdaq US Rising Dividend Achievers™ Index (the “index”) and is comprised of a selection of companies with a history of raising their dividends and that exhibit the characteristics to potentially continue doing so in the future.
- The index is comprised of four sub-portfolios.
- Each sub-portfolio is reconstituted and rebalanced on a staggered schedule so that one sub-portfolio is rebalanced and reconstituted each quarter in March, June, September and December and equally weighted.
- At reconstitution the sub-portfolio begins with the stocks in the Nasdaq US Benchmark™ Index, and eliminates those companies classified as a Real Estate Investment Trust by the Industry Classification Benchmark.
- The starting universe is comprised of the largest 750 companies with a minimum three-month average daily dollar trading volume of $5 million. Companies over 3% at the index level are ineligible for inclusion.
- To be eligible for inclusion in the index, companies must have:
- paid a dividend in the trailing twelve-month period greater than the dividend paid in the trailing twelve-month period three and five years prior.
- positive earnings per share in the most recent fiscal year greater than the earnings per share three fiscal years prior.
- a cash to debt ratio greater than 50%.
- a trailing twelve-month period payout ratio no greater than 65%.
- Eligible securities are ranked by a combined factor of dollar dividend increase over the previous five year period, current dividend yield, and payout ratio.
- Up to 50 eligible securities with the lowest (most favorable) combined ranks are selected for inclusion in each sub-portfolio.
- At least 33 of the selected companies must be classified as large-cap.
- The reconstituted sub-portfolio is then combined with the sub-portfolios not undergoing a reconstitution to form the index.
- The index is rebalanced annually so that each of the four sub-portfolios is equally weighted among each other, each representing 25% of the total index weight.
| Ticker | RDVY |
| Fund Type | Equity Income |
| Investment Advisor | First Trust Advisors L.P. |
| Investor Servicing Agent | Bank of New York Mellon Corp |
| CUSIP | 33738R506 |
| ISIN | US33738R5063 |
| Intraday NAV | RDVYIV |
| Fiscal Year-End | 09/30 |
| Exchange | Nasdaq |
| Inception | 1/6/2014 |
| Inception Price | $19.93 |
| Inception NAV | $19.93 |
| Rebalance Frequency | Quarterly |
| Total Expense Ratio* | 0.48% |
* As of 2/3/2025
The Investment Advisor has implemented fee breakpoints, which reduce the fund's investment management fee at certain assets levels. Please see the fund's Statement of Additional Information for full details.
| Closing NAV1 | $58.51 |
| Closing Market Price2 | $58.54 |
| Bid/Ask Midpoint | $58.52 |
| Bid/Ask Premium | 0.02% |
| 30-Day Median Bid/Ask Spread3 | 0.03% |
| Total Net Assets | $13,372,369,656 |
| Outstanding Shares | 228,550,002 |
| Daily Volume | 816,081 |
| Average 30-Day Daily Volume | 1,032,770 |
| Closing Market Price 52-Week High/Low | $64.37 / $53.05 |
| Closing NAV 52-Week High/Low | $64.34 / $53.04 |
| Number of Holdings (excluding cash) | 76 |
| Holding |
Percent |
| Unum Group |
2.54% |
| Visa Inc. (Class A) |
2.35% |
| The Bank of New York Mellon Corporation |
2.33% |
| eBay Inc. |
2.29% |
| Automatic Data Processing, Inc. |
2.19% |
| Snap-on Incorporated |
2.19% |
| The Hartford Insurance Group, Inc. |
2.19% |
| Chubb Limited |
2.18% |
| Aflac Incorporated |
2.15% |
| JPMorgan Chase & Co. |
2.14% |
* Excluding cash.
Holdings are subject to change.
Past performance is not indicative of future results.
 Among 1,094 funds in the Large Value category. This fund was rated 3 stars/1,094 funds (3 years), 4 stars/1,031 funds (5 years), 5 stars/802 funds (10 years) based on risk adjusted returns.
| Maximum Market Cap. | $3,336,853 |
| Median Market Cap. | $41,969 |
| Minimum Market Cap. | $6,086 |
| Price/Earnings | 14.26 |
| Price/Book | 2.63 |
| Price/Cash Flow | 12.08 |
| Price/Sales | 2.06 |
|
|
2024 |
Q1 2025 |
Q2 2025 |
Q3 2025 |
| Days Traded at Premium |
214 |
53 |
--- |
--- |
| Days Traded at Discount |
38 |
7 |
--- |
--- |
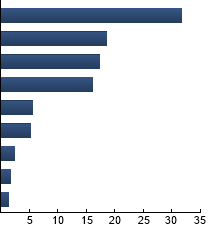
|
Financials
|
31.75%
|
|
Technology
|
18.60%
|
|
Industrials
|
17.30%
|
|
Consumer Discretionary
|
16.03%
|
|
Energy
|
5.58%
|
|
Basic Materials
|
5.19%
|
|
Health Care
|
2.43%
|
|
Telecommunications
|
1.80%
|
|
Consumer Staples
|
1.32%
|
|
|
Tracking Index: Nasdaq US Rising Dividend Achievers™ Index
| |
Standard Deviation |
Alpha |
Beta |
Sharpe Ratio |
Correlation |
| RDVY |
21.11% |
1.85 |
1.10 |
0.36 |
0.92 |
| Dow Jones U.S. Select Dividend Index |
17.63% |
--- |
1.00 |
0.30 |
1.00 |
Standard Deviation is a measure of price variability (risk). Alpha is an indication of how much an investment outperforms or underperforms
on a risk-adjusted basis relative to its benchmark.Beta is a measure of price variability relative to the market. Sharpe Ratio is a measure
of excess reward per unit of volatility. Correlation is a measure of the similarity of performance.
Dow Jones U.S. Select Dividend Index - The Index consists of 100 widely-traded, dividend-paying stocks derived from the Dow Jones U.S.Total Market IndexSM. S&P 500® Index - The Index is an unmanaged index of 500 companies used to measure large-cap U.S. stock market performance.
|
|
The information presented is not intended to constitute an investment recommendation for, or advice to, any specific person. By providing this information, First Trust is not undertaking to give advice in any fiduciary capacity within the meaning of ERISA, the Internal Revenue Code or any other regulatory framework. Financial professionals are responsible for evaluating investment risks independently and for exercising independent judgment in determining whether investments are appropriate for their clients.
|